Africa Sustainable Development Goals Progress Report
Technical notes
The assessment for the Africa Sustainable Development Goal Progress Report builds on the methodology developed by the Economic and Social Commission for Asia and the Pacific for its own progress assessment. The present assessment is based on the global indicator framework for the Sustainable Development Goals and targets of the 2030 Agenda for Sustainable Development, as adopted by the General Assembly on 6 July 2017 (resolution 71/313). Data were compiled from the Global Sustainable Development Goal Indicators Data Platform.
Measures for tracking progress
Two principal measures – current status index and anticipated progress index – are used to assess regional and subregional progress towards achieving the Sustainable Development Goals. The two indices answer the following two different questions:
- Current status: how much progress has been made since 2000?
- Anticipated progress: how likely is it that the target values will be achieved by 2030?
The current status index measures progress towards achieving a specific Sustainable Development Goal target since 2000, while the anticipated progress index measures the gap between the predicted value of the indicator and the specified target value. Both indices are constructed at the subindicator level (series, disaggregation or subcomponents of an indicator) and can be aggregated at the indicator, target and Goal levels. In this analysis, the current status index is presented at the Goal level (snapshot) and the anticipated progress index is presented at the target and indicator levels (dashboard and progress gap).
Current status index
Given a specified Sustainable Development Goal target value for each indicator, the indicator values for current year and 2000 can be used to construct a metric that measures the progress made since 2000, in relation to the progress needed to achieve the target by 2030. The current status index is constructed in two steps:
Step 1. A metric is developed for each indicator to measure the progress made; the metric can then be compared with the entire amount of progress needed from 2000 to 2030.
Step 2. To see how much progress has been made – and still needs to be made – to achieve the Goal, the metrics computed in step 1 are combined into one index that indicates the “average progress made” and the “average progress required” on a fixed scale.
Denoting indicator values for 2000 and the current year by I0 and Icv and the target value for 2030 by “TV”, and setting the normalized values of the indicator at 2000 and 2030 at 0 and 10, respectively, the current status index can be calculated as:
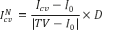
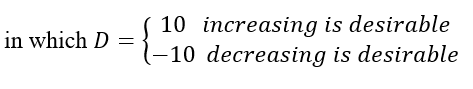
when the desirable direction is clear.
For parity indicators, the value is:
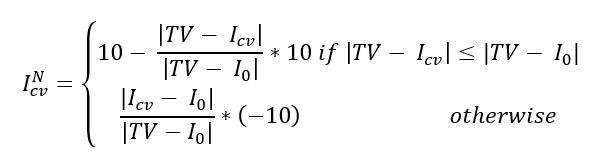
The index is normalized to be in the interval [-10;10].
Example:
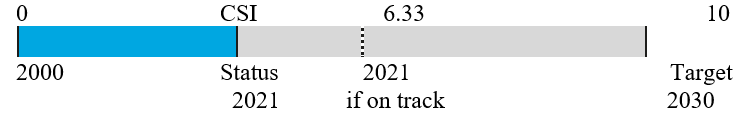
Based on the results, the following conclusions can be drawn:
- If the index is negative, the region has regressed since 2000
- If the index is positive and higher than 80 per cent of the needed progress (the value to be on track), the region (or subregion) has made good progress
- If the index is positive and less than 80 per cent of the needed progress (the value to be on track), the region (or subregion) has made low progress or has stagnated
- If the current value of an indicator has already reached or exceeded the target value, the index is automatically set to 10
Anticipated progress index
This index compares the predicted (anticipated) progress with the targeted progress. By predicting the indicator value for the target year and benchmarking the predicted value against the target value, it is possible to identify how close a region or subregion can get to the target by the end of the target year (2030), assuming the previous pace of progress.
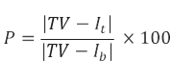
Denoting the predicted value of the indicator I for the target year by It and the value in the base year by Ib, the progress gap can be approximated by P when no regression has occurred, and by 100 – P when the indicator value has regressed since the base year. If the desirable direction is clear from the target, the value of P is defined as:
In the case of parity indicators, it is considered that no regression has occurred if 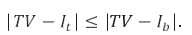
The anticipated progress index only needs to be calculated for indicators that are not expected to achieve the target. Indicators for which the predicted value has already reached or is expected to reach the target by 2030, or for which it has exceeded the achievement level, are automatically classified as “will be achieved” and the anticipated progress index is set to 0.
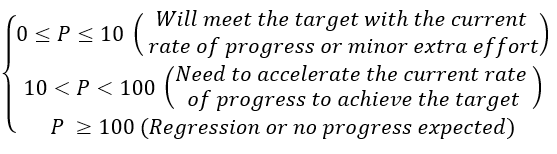
Based on expected progress, the value of P ranges from 0 to 100. If there is a predicted regression from the current level, P will be greater than 100.
P may be interpreted as the extra effort or acceleration needed to meet the target when the value is less than or equal to 100, and 100 – P is the amount of regression when it is greater than 100. Indicators are classified into three predefined achievement levels:
Selection of indicators
Indicators from the Global Sustainable Development Goals Indicators Database were selected based on the availability of data: starting from 2000, there should be two or more data points for more than 40 percent of the countries in the corresponding region or subregion.
In total, 86 indicators were used to compute the current status index for the Sustainable Development Goal progress assessment in the present report. Of these, however, six indicators did not provide sufficient data for the 2030 predictions and were not used for the anticipated progress index calculations.
Aggregation
When more than one variation for an indicator existed (for example, 9.c.1 – Proportion of population covered by a mobile network (2G, 3G, 4G)), all variants were used in calculations. Each variant of an indicator was weighted such that the sum of the weights under each indicator was 1. Finally, a weighted average of the progress indices was computed as a progress index for that indicator. The same approach was used for aggregation at the target and goal levels.
The median value of indicators at the regional and subregional levels was used instead of weighted aggregates to avoid bias towards bigger countries and economies (Bidarbakht-Nia, 2018).
Leaving no one behind – disaggregated statistics
Disaggregation by sex, location or a combination of age and sex was available for 21 indicators (spread across Goals 1, 3, 4, 6, 7 and 8). To take the concept of leaving no one behind into account, a vulnerable group for each indicator was identified as the group that had the worst situation in the entire reference population.
Extrapolation methods
Producing the two above-mentioned measures of progress required a set of values for 2000, 2015 and 2021, and an estimate for the target year (2030). These values, when not available, were estimated using a weighted regression method based on time-related weights (Bidarbakht-Nia, 2017). This approach assumes that the importance attached to the indicator values should be proportional to how recent their data are.
Suppose that n data points are available for indicator I for a given region over a period of T years, and there is an interest in estimating the indicator value for the year t(n+a) (a=1, 2, ...).
T=tn-t1 where tn and t1 are the latest and the earliest years, respectively, for which data on indicator I are available. The time-related weights work as a multiplier that inflates or deflates the rate of change in each period in proportion to its temporal distance to the target year (tn+a). The time-related weight for the ith observation for a given region is:
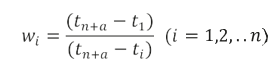
for estimating values of 2015 and later, and
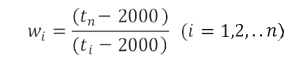
for estimating 2000 values.
Weights are then incorporated into a regression model used for different indicators. In a few exceptional cases where the indicator was time-independent, time-related weights were not used (e.g., disaster-related indicators, official development assistance and other financial aid).
Setting regional target values
Of the 169 Sustainable Development Goals targets, only 30 percent have specific (implicit or explicit) target values. For the rest, target values for the present report were set using a pragmatic and ambitious approach: champion area. The approach is based on what has proven feasible in the past on the continent and optimizes the use of available data. The idea is to identify the region’s outstanding countries (top performers) and to set their average rate of change as the region’s target rate. Imagine the top performers as belonging to one hypothetical area, labelled as the region’s champion area, for which the rate of change equals the average for the top performers for one specific indicator. This can then be considered the target rate for the region. In other words, if the region as a whole can perform as well as its champion area over the 15 years (the Sustainable Development Goal era), then the region is expected to achieve the target value by 2030. Consequently, the universal target value for the region can be derived by applying the rate of change in the champion area to the regional value in the base year. In the present report, the regional value is the median value of the indicator over all countries for which data are available.
The main challenge with the champion area approach arises when dealing with indicators for which most of the countries started from a very low level and made such rapid progress during the past 15 years that the observed growth rate cannot reasonably be applied to the future. For example, the proportion of parliamentary seats held by women (5.5.1) and the number of automated teller machines (ATMs) per 100,000 adults (8.10.1). The rapid changes in these areas may have been attributable to technological advances, the exploitation of untapped resources or a paradigm shift brought about by a development agenda such as the Millennium Development Goals.
In such cases, rather than using the rate of change, the top five performers were identified based on the latest available data. The region’s target value for the champion area was then taken to be the average value for the five best performing countries – using the largest or smallest values, depending on whether the desirable direction of change was an increase or a decrease. Before identifying the top five performers, outliers were dropped to avoid bias.
Assume that a target value has been set for indicator I:
Case 1. At least two data points are available since 2000 for a number of countries that show a diverse range of changes. In this case, the earliest and latest available data for the five countries with the highest rates of change are used to calculate the average annual rate of change over the five highest rates of increase or decrease.
The average rate of change in the region (r) is calculated in two steps. The first step is to estimate the geometric mean of the average annual growth rate for each country based on the earliest and latest indicator values. The second step is to take a geometric mean over the top five rates of change. It is often the case that one or a few countries experienced exceptional growth. These outlier countries are dropped from the calculations in order to ensure that the average of the top five performers is a realistic and achievable, yet aspirational, target for the rest of the countries.
The target value for the indicator is calculated as:
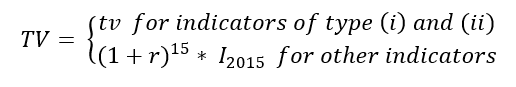
Case 2. For indicators for which most countries started from a very low level and made rapid progress over the past 15 years, the latest data for each country are used to calculate the target value.
The target value is the average of indicator values for the five countries with the largest or smallest values, depending on whether the desirable change is an increase or a decrease (after dropping outliers, as in Case 1).
When unavailable, the indicator value for the base year (I2015) can be estimated by applying an appropriate extrapolation method (as described above).
Confidence of results at the Goal level
Owing to limitations on data availability, the results aggregated at the Goal level are based on a percentage of the total global Sustainable Development Goal indicators. The strength of evidence is thus defined as the following ratio:
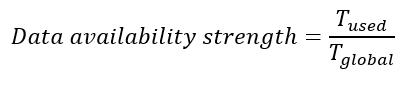
where Tglobal and Tused represent, respectively, the total number of indicators in the global indicator framework for the Sustainable Development Goals and targets and the number of global indicators used in the calculations.
For ease of analysis, a strength symbol denotes the evidence strength factor according to the table below.
|
Symbol
|
Data availability strength
|
Interpretation
|
|

|
0
|
No indicators available
|
|

|
]0; 1/3]
|
Insufficient indicators
|
|

|
]1/3; 2/3]
|
Moderate availability
|
|

|
]2/3; 1[
|
High availability
|
|

|
1
|
Full availability
|